

It’s a bird! It’s a plane! Nope – it’s just another month passing by. From a financial perspective, the year has been off to a stellar start. However, as you may have noticed in some of my earlier posts this year, it has personally been very challenging. It’s been a perfect storm of sorts. It’s been difficult to find a balance between tending to my new business and spending quality time with my family. It doesn’t help that the household has been catching one bug after another the past five weeks. I am optimistic that March will bring a much needed change to our household’s state of health because we are DONE being sick.
The good news is that my wife and I are checking in regularly to stay aligned and on the same page. I also have a strategic hire starting on April 1st full time, which will help take some things off my plate. I knew this new business would be really hard at times but I want to make sure that I stick true to my goal of creating a business that empowers my lifestyle, not one that inhibits it. The high-level goal the GYFG household is optimizing for is the trifecta of time freedom, location freedom, and financial freedom. For now, while we get it all in place, we still have work to do on the time freedom piece of the puzzle!
If you’re a regular reader and only want to read the new content, feel free to just skip the intro below, and head to Net Worth. If you are new or haven’t read many of these reports, I encourage you to take two minutes to read the intro below, which does change periodically.
Why I Share These Monthly Reports
Mission Statement: To Humanize Finance, Build Wealth, and Reach Financial Freedom.
For those of you new around this corner of the internet, these monthly reports are about full transparency. And, they are just as much for me as they are for you. It was a hard decision to make all of my financial details public, but it has proved to be a very motivating one. The process I go through every month to produce these reports has been enlightening and life-changing. I published my first “income and net worth report” for January of 2015 when our net worth was only $195,141 (we entered 2015 with a net worth of $181,364) and our gross income was on pace to hit $178,000 that year.
Five years (and one month) later, our net worth currently clocks in at $1,814,003 with a gross income over the trailing twelve months of $1,196,361.
- That’s a 10.0X increase in net worth due to a compound annual growth rate of roughly 59% for the past five years.
- At the same time, income has increased 6.7X, which translates to a compound annual growth rate of roughly 46.4%.
Honestly, I don’t think the GYFG household would have experienced these kinds of results without the existence of this blog and the accountability it brings. Knowing that I will share our results with you readers every month keeps me very focused and intentional with all things related to our financial well being. For that, I THANK YOU for taking the time to read and interact with me on this blog.
Above and beyond this benefit to my own household, my sincere hope is that my policy of full transparency will inspire you to take the helm of your own financial ship and be intentional with its direction. I truly believe that anyone can reach financial freedom if he or she is willing to do things differently than the pack does. If you’re after average results, then you’ve landed on the wrong site. There’s nothing wrong with average, but the kind of results I preach are EXTRAORDINARY. Sure, the “get rich slow” method is proven, but there is an alternative, which is to “get rich fast.” Look, I have no interest in living like a starving college student until I am old and brittle to only then have the means to check off bucket-list items when my body might no longer be physically capable of doing them. And I don’t want that for you either!
Here at GYFG, we approach the pursuit of FINANCIAL FREEDOM with an abundance mindset, so you won’t hear me telling you to cut out those $5 lattes. Choose to spend on what is meaningful to you. I spend a lot, but I also strategically earn a lot, save a lot and invest a lot.
I hope these reports inspire and move you to action. Don’t take a passive role in your finances and hope for the best. Keep this famous Jim Rohn quote in mind:
“If you don’t plan your future, somebody else will. And you know what they have planned for you? NOT MUCH!“
You must be intentional with your finances if you ever want a fighting chance to make it to financial freedom. But it does not have to take 40-50 years of slaving away for “The Man” before you have the option to retire. I think 10-20 years is all you need, with the most aggressive folks probably able to reach financial freedom in 10 years or less. A high income paired with a high savings rate are two of the vital components of a good recipe for the 10-year track.
I know I don’t have to publish my juicy details every month, but it’s important to me that you know that I put my money where my mouth is (not so many people giving financial advice actually do this). I publish all of my financial details not to brag, but instead to show you what is working as well as what’s not working. Sometimes finance can get pretty dense, and I think real life examples and numbers can help slice through the complexities (and the BS). Personally, I have always enjoyed the financial reports put out by other bloggers around the blogosphere, so I always intended to share my own.
My goal is to be a beacon of hope, motivation, and inspiration for YOU, the reader, by living life by example and sharing it all here on the blog.
You can find all my previous reports on the Financial Stats page.
Financial Stats Dashboard
At the end of each month, I download a .csv file from my Personal Capital account and drop it into my custom built Excel workbook in order to update the dashboard you see below. I’m blown away every month by the progress we have made in a relatively short period of time. The only number below that is not an actual number and instead is a forecast is the current year projected income of $1,036,445 in the gross income chart below.

Now that we have seen the overall, let’s take a closer look at a few of the items below.
Net Worth
We finally got cashed out of the stock and options I held from my previous employer and the value ended up being a little better than what I had been carrying on the balance sheet ($537K vs. $520K). Net worth only got the benefit of the incremental of the value I had estimated vs. the actual payout (not bad, I estimated within 3%). For the month our net worth was up $46,470 or 2.6%.
From time to time I like to look at the growth of our net worth over the last three years and here is what that looks like:
February 2018 vs. February 2017- Total Increase of $192,384 or 36.1%
February 2019 vs. February 2018 – Total Increase of $361,902 or 49.9%
February 2020 vs. February 2019 – Total Increase of $727,126 or 66.9%
As the numbers get bigger I have a hard time seeing this trend continuing. My gut tells me this is probably a top for some time but that might be my conservative nature coming out, especially in light of all the market volatility recently. You may be wondering why we had such a great month when many probably saw lots of red due to the large drop in stocks during the last week of February. This is largely driven by three major themes:
(1) We are holding 37% of our assets in cash (really almost 47% when you consider #2 below).
(2) The majority of our investments are outside of the stock market. Only 14% of our assets are in brokerage accounts but $172K (or 9.5%) of the 14% is sitting in a money market account as we prepare to roll it over to my own IRA account (it’s been sitting in that money market since November of 2019).
(3) We also hold a lot of nontraditional assets that don’t necessarily correlate with stock market (i.e., life settlements, hard money lending, etc.).
We will be gunning for $2,000,000 net worth during the first six months of 2020, which will catapult us to the fourth milestone of The Five Major Milestones to Financial Independence (only $74,000 away from this milestone).

February Net Worth $1,814,003 (up $143,682 or +8.6% for 2020)
- Previous month: $1,767,532
- Difference: $46,470
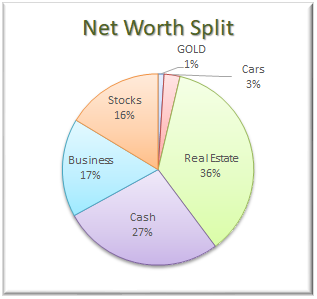
Net Worth Break Down (MoM):
 The Real Estate ($794,768) category decreased from 45% to 44%. This category includes the equity in our primary residence ($463,896), a hard money loan ($150,000) at a 10% interest rate, our investment in the Rich Uncles commercial REIT ($78,824), and our hard money loans through the PeerStreet ($102,048) platform. In March we will increase our investment with Rich Uncles so it hits a six-figure balance.
Net Cash ($665,945) increased from 9% to 37%. Keep in mind that of that $665,945 a portion (~$89K) is related to what my business owes me (a combination of my direct billable work and the profits of the business). The cash category will not stay this elevated for long as we have already identified a home for about $385,000 to be deployed in March.
The Business ($0) category decreased from 29% to 0%. Now that my position from my former employer has been liquidated, the business category is zero. I’m still undecided as to whether I want to hold a value here for my own new business.
Life Settlements ($97,001) decreased from 6% to 5%. We currently have investments in seven policies at $10,000 each. They are accreting in value by about $1,000 per month. For anyone familiar with options, I liken the fixed return of life settlements to the theta of a short option. In this case, the accreted value is like the theta decay of an option you’ve sold. In more simple terms, with this fixed return you are amortizing (realizing) that value with the passing of time. Two of these policies have required capital calls as the insured has lived past the estimated life expectancy (that eats into the expected return).
The Stocks ($256,289) category increased from 11% to 14% and represents the cumulative value of our brokerage accounts (retirement accounts) that are invested in stocks. However, this is not all of our retirement money, as the majority of our PeerStreet investments are made through a self-directed IRA (worth about $84,000 and counted in the Real Estate category of the pie chart). I did pay back the 401K loan this month. Keep in mind that about 9.5% or $172,000 is sitting in a money market account while I wait for my employment status to change to inactive so I can roll it over to my private IRA.
Total Capital Deployed in 2020:

I have officially maxed out my 401K for 2020 and Mrs. GYFG should be maxed out by the end of April. We do plan to deploy about $20,000 to Rich Uncles to finally hit the six-figure balance goal I’ve been targeting for at least a year now. I also pulled the trigger on setting up two CD’s yielding 3.5% for the next 12 months through my credit union (that was the max). In addition, I moved $50,000 over to CIT bank which is yielding 1.75%, and came with a $300 bonus (bringing the yield up to 2.35% for the year). In March we will be deploying $385,000 in a long-term very illiquid investment (details to come in time), $4,000 in Mrs. GYFGs 401K, and the remaining amount we need to bring Rich Uncles up to a round six-figure sum.
TTM Gross Income
Starting this month I will now only be reporting TTM Gross Income. With the business, I believe there is going to be a lot of volatility from month to month and I’m more concerned with looking at the trend of our income than at the individual monthly value. We recorded a new all-time record in TTM income at $1,196,361 (up from the TTM of $764,863 last month). This is largely driven by the realized gain that finally made its way from the balance sheet to the income statement once the proceeds hit our checking account. I don’t see the GYFG household challenging this TTM figure anytime in the near future.

Savings Rate
I have made a decision to no longer track our detailed expenses, which means I will no longer be tracking our savings rate. Our goal remains saving 50% of our after-tax income. In 2019 we achieved a 60% savings rate, and we anticipate that or better in 2020. This does not mean I think a high savings rate is no longer important, it’s just that I don’t find it necessary for us to track it any longer due to the good habits we have built and the exponential growth in our income.
Below is a historical snapshot of our after-tax savings rate since we started tracking it in 2015.

Do you want to calculate your own savings rate? I’ve made it super easy for you with the savings rate calculator included in the free GYFG FI Toolkit that you can download instantly by clicking the link below. Here’s a peek. Did I mention it’s free? You have nothing to lose and everything to gain, Freedom Fighter! Remember, what gets measured gets managed.


Speaking of savings rate, go check out my post where I mathematically prove the importance of your savings rate as a higher priority in achieving financial independence than your compound return. If you’re trying to build wealth quickly, then you have to read this post.
Closing Thoughts
Time is flying by way too fast…I need a better mousetrap for allocating that time to the right buckets. I haven’t been spending enough time when it comes to my health and fitness. I also haven’t been spending enough time being the husband and father I want to be. March will be focused around re-prioritizing my time to spend it much more consciously and wisely. I understand that the idea of balance is elusive for someone like me because things are in a constant state of movement but that just means I have to be extra diligent in managing my time to make sure the pendulum doesn’t swing too far to either side before I self-correct.
I encourage each of you to also take inventory of where you are spending your time and to self-correct if it isn’t aligned with your values and priorities. Time is the most valuable and fleeting asset we each have – limited and nonrenewable. I once wrote a post titled “Don’t Get So Consumed Building Wealth That You Forget To Build A Life” that I’m going to go re-visit during this reset in March – if needed, I encourage you to do the same.
Cheers,
– Gen Y Finance Guy
5 Responses
Do you ever feel you are one health crisis, illness or injury away from financial disaster?
If something happened today where you could no longer work how long would your assets last… esp given your high level of spending.
Given your high income would have expected your networth to be growing considerably faster.
Fingers crossed until you get to your FF number.
Hi Mel,
I do not not ever feel like I’m one health crisis, illness, or injury away from financial disaster. My family has a paid-off house with no debt and enough cash in the bank to sustain our current lifestyle for at least seven years if not longer. That doesn’t count the passive income that we have built that would continue even if I stopped working or if something happened to me.
Our spending is not very high relative to our income. We save 50% or more of everything we make.
I can see why you would have expected our net worth to grow faster with our income. This month specifically is a little misleading because a large majority of the $490,000 income was due to liquidating my equity stake in my previous employer, which was a value that was already being carried on the balance sheet (and thus already in the net worth total before February). The income is super high because it is the first time the gain had been realized and passed through the P&L.
As far as our net worth growing faster overall compared to our high income. As a bit of context, our household has earned approximately $2.74M over the prior 62 months and in that time we have grown our net worth from $181,364 to $1,814,003 (that is very high income to net worth conversion ratio). It represents a compound growth rate over the 62 months of 58.5%.
I think we have done pretty good but I’m open to suggestions on how we could do better if you have any to share.
I look forward to your suggestions.
Great reply ????????