

Wow! I never imagined that it would take less than 100 financial update posts to reach my $10M net worth goal, yet here we are. Of course, I did switch from monthly to quarterly updates this year but that still would have put me at 96 posts vs. 88. It’s a little bittersweet that this is the last financial update in this format that I will be providing. My plan is to move to more of an annual letter format that will be part financial update, part reflection, and part projection. I have to spend time really thinking through what I want to share going forward.
A few call-outs:
(1) I struck a sweet deal to sell the remaining 40% of my company 15 months after selling the first 60% and four years earlier than the contractual exit I had previously negotiated.
(2) The above allowed us to not only hit but exceed our target $10M net worth goal.
(3) The above allowed the GYFG household to finish the year with a YoY increase of 35% to our net worth in a year when most assets finished the year in negative territory.
With that, let’s dive in!
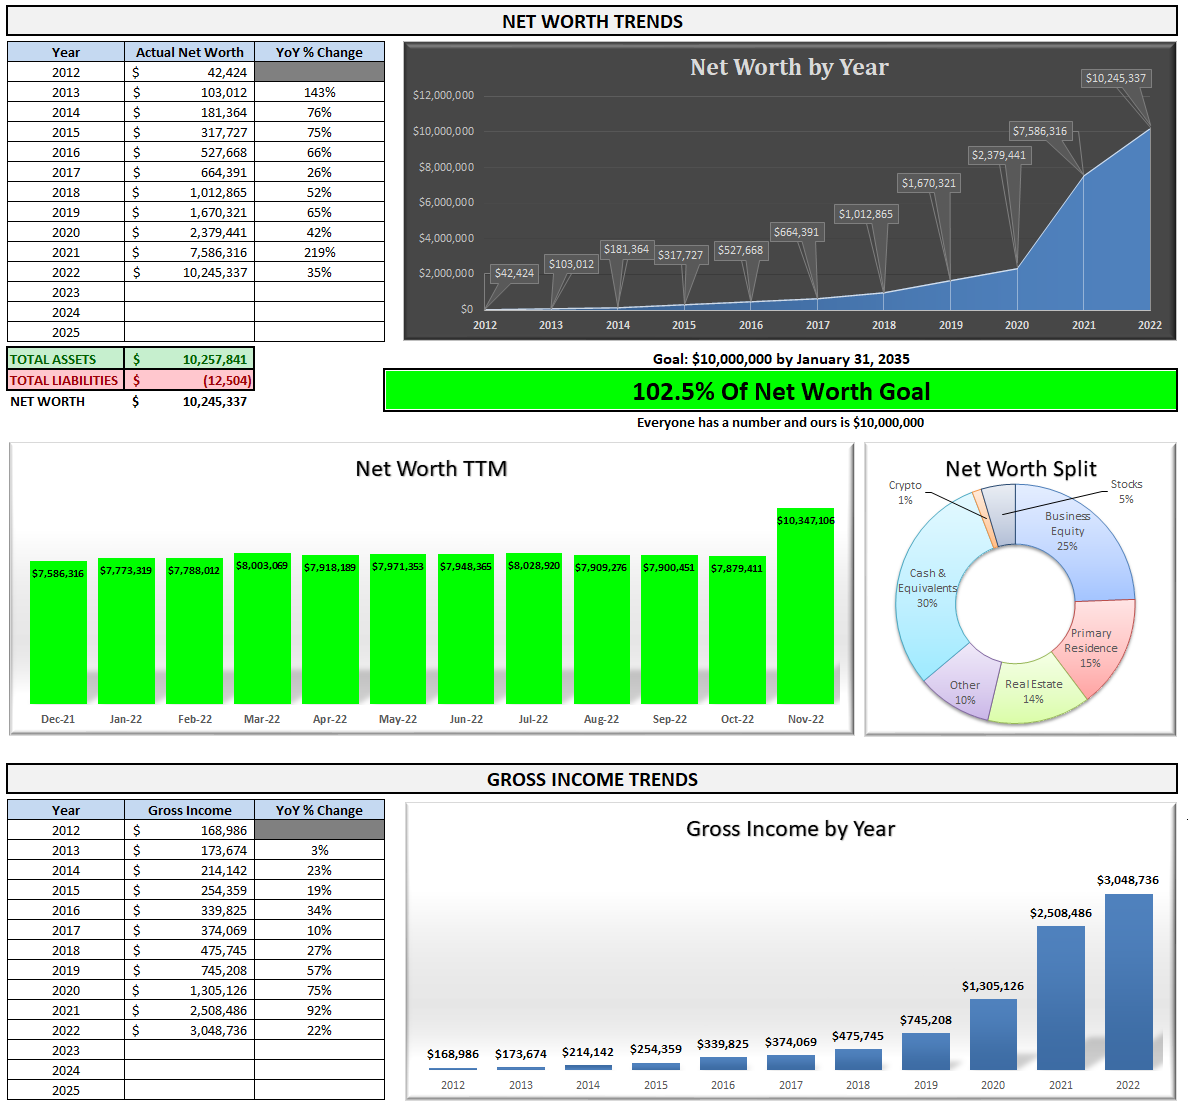
Financial Dashboard
I remember when I first created this financial dashboard back in 2015 and how that first update I shared had us at less than 2% of the way to our $10M goal. Here we are, seven years later with the goal achieved 13 years ahead of schedule. The most astonishing thing to me is the compound annual growth rate (CAGR) we have been able to maintain since 2012. Our income has grown at a robust ~33.5% CAGR. Even more mind-blowing is that our net worth has been compounding at a ~73.1% CAGR during that same time period. From the end of 2012 through December 2022, we’ve grown our net worth by 24,050%.
To put that in perspective, our net worth has doubled almost nine times in the last decade! AND 90% of the net worth increases (~$9.2M) from December 2012 to December 2022 have happened in the last four years leading up to December 2022, which also happens to align with when I started my business. The magic of owning a business is that you get to quadruple-dip: enjoy a salary, profit distributions, and a more tax-efficient life, while at the same time build equity based on some multiple (on revenue or profits depending on what industry you’re in) of past results (adjusted with some assumptions of future performance in relation to past performance).
The best $267.42 I’ve ever spent!
For example, let’s say you have a consulting business that generates $1M a year in profits and that you’ve been running it for at least three years. During your tenure of running the business, you paid yourself a $250,000/year salary and you own 100% of the company so you get to reap all the profits every year (ignoring working capital needs for this example). Also, to simplify the example let’s assume that from day one that you were generating $1M a year in profits. So, over three years you got to enjoy $750,000 in cumulative compensation in the form of salary and $3M in profit distributions for a total of $3,750,000. That by itself is a pretty sweet deal…but that’s not all of the sweetness. Your business now is established with three years of history and has further value for you to extract. Multiples are all over the place but let’s assume that you find an interested buyer and they are willing to value your business at 5X profit. All of a sudden you now have another $5M if you decide to sell. There are an infinite number of permutations to this example but I think you get the point of how owning a business allows you to at least double-dip…and the importance of setting it up right from the beginning with all these considerations in mind, including – and especially – a potential exit.
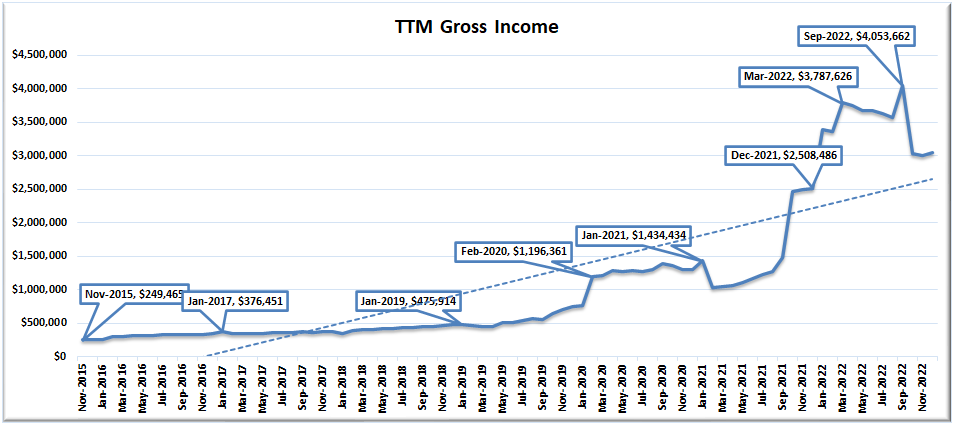
TTM Gross Income
The income figure I like to track most is our Trailing Twelve Month (TTM) gross income. As expected, our TTM income dropped by almost $1M (to $3,048,736) this quarter vs. the last all-time high in September at $4,053,662, and we expect a continued decline over the next 12-24 months. Having said that, 2023 is not going to drop the 75% I had originally thought and will be more of a 50% drop due to new developments (mainly selling the remaining equity in my business).
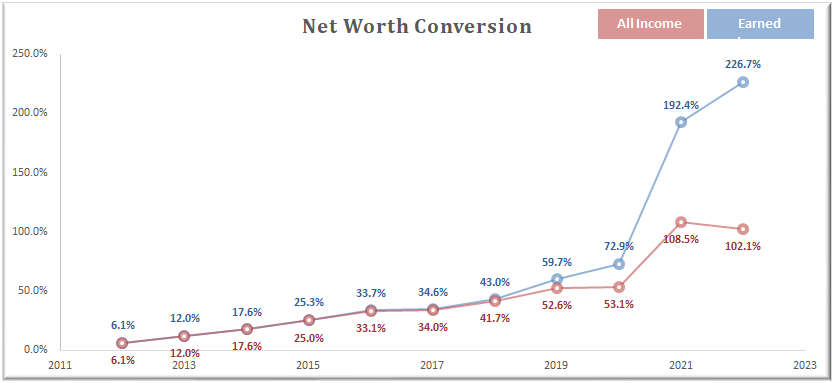
Net Worth Conversion
Current Net Worth: $10,245,337 (up $2,659,021 or +35.1% for 2022)
Previous Quarter: $7,900,451
Difference: $2,344,886
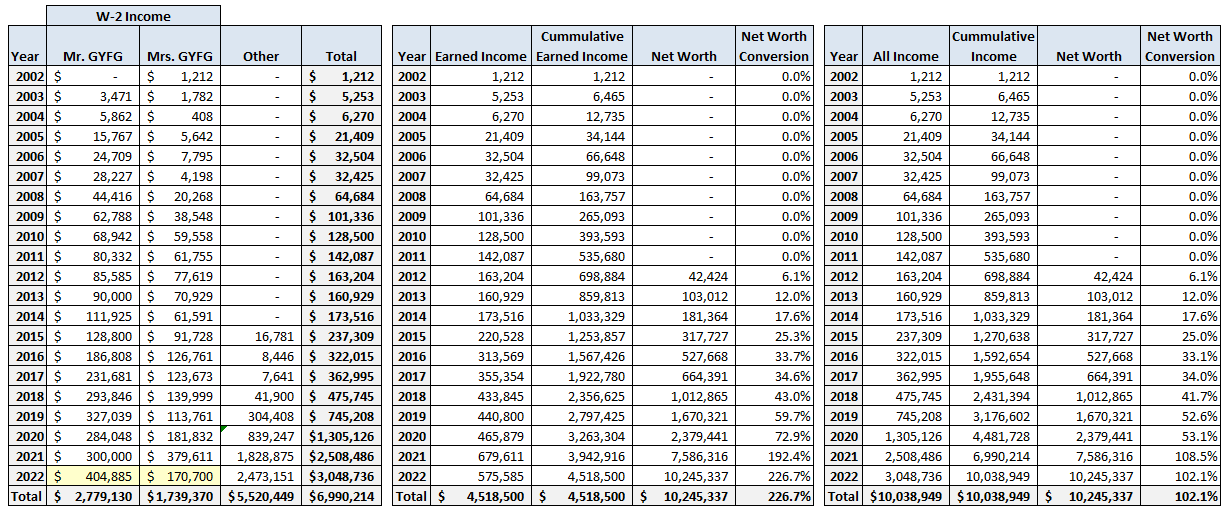
Last year (2021), the big milestone was hitting both Financial Independence and Financial Freedom (see five major milestones). We also hit Financial Nirvana last October, which I defined way back when as the point at which your net worth exceeds your lifetime earned income (see Net Worth Conversion Ratio). You can build wealth either through labor or capital. The goal is to eventually get to a point where labor becomes optional and your capital does all the heavy lifting for you.
I like to look at this metric on both an “Earned Income” and an “All Income” basis. The reason I also like to look at the “All Income” version is to get a sense of both savings and tax efficiency. It’s not perfect but gives me an idea of where I am – the closer I am to 100% the more tax efficiency I’ve experienced, meaning that if both numbers produce a 100% or greater reading, I have lived for free inclusive of taxes. Now, I’ll point out that part of the reason the “All Income” metric is reading over 100% is that there are large unrealized gains that have yet to be taxed.
Note the gravitational pull our goal of saving 50% (set in 2015) of our after-tax income had on this metric. If you pair the above chart with the actual numbers in the below tables, you can really start to see why a rising income was so magnetic in dramatically lifting the conversion rate between 2015 through 2022. There was not much delta in the early years on the chart between the red and blue lines. That delta started to dramatically increase in 2020 as we began experiencing liquidity events from equity we owned both in other people’s businesses and our own. Prior to this we were saving and paying down our mortgage with nominal amounts going into other investments. With the benefit of hindsight, I can also share that our net worth was significantly understated in 2019 through mid-2021 since we were not carrying any value for my business until a legitimate buyer showed up.
Net Worth Break Down:
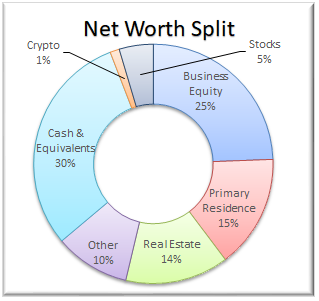
For those that missed my last post, I shared a more detailed deep dive into what actually makes up the seven major categories reported below.
Real Estate (14%) – This is a mixture of private placement deals, equity, debt, and crowdfunding.
Primary Residence (15%) – Since late 2020 we have now plowed $1M of cash into this home and our portion is currently worth ~$1.5M. We expect to spend an additional $200,000 to finish up our list of renovations next year (2023).
Cash & Equivalents (30%) – We currently have $3,100,000 in cash vs. $1,590,815 last quarter-end. About half of this cash is being invested into short-term treasuries earning 4% or more while we sit on our hands and see how 2023 starts shaping up. The other half is essentially a receivable as we expect to receive $1.1M in cash from the business sale in January of 2023 and another $500K in January of 2024 (this delay will help with tax planning). The plan is to put most of the cash received this January into short-term treasuries initially.
Alternatives/Other (10%) – This is a catch-all category that captures our investments in the following: life settlements, Bowery Farming (a vertical farming company), Private Equity Fund, a Wine Village, and Cannabis-related investments.
Business Equity (25%) – As a part of selling the remaining 40% of my business, I’ve taken a percentage of the proceeds in cash, and the remaining value I’ve rolled into the equity of the acquiring company – still keeping significant skin in the game.
Crypto (1%) – This is 100% Bitcoin.
Stocks (5%) – This is up 100% in absolute dollars but is still lower than the target allocation. We will continue to increase this allocation as we move throughout 2023 (the goal is to end 2023 in the range of 10-15% – on the higher end if prices continue to fall).
Note: I’m noticing that I am biased towards investing in illiquid assets and that is because I like the forced discipline they bring to the table. I continue to see a lack of liquidity as a benefit, not a bug…as long as I can maintain the right amount of liquidity in terms of monthly cash flow and cash in the bank. It’s funny because in my original $10M blueprint I had projected stocks making up ~60% of net worth, but that obviously isn’t the case as my current allocation is less than 10% of that target. I do think the stock allocation will increase over time but I have a hard time seeing it getting anywhere close to 60% at my current vantage point.
Total Capital Deployed in 2022:
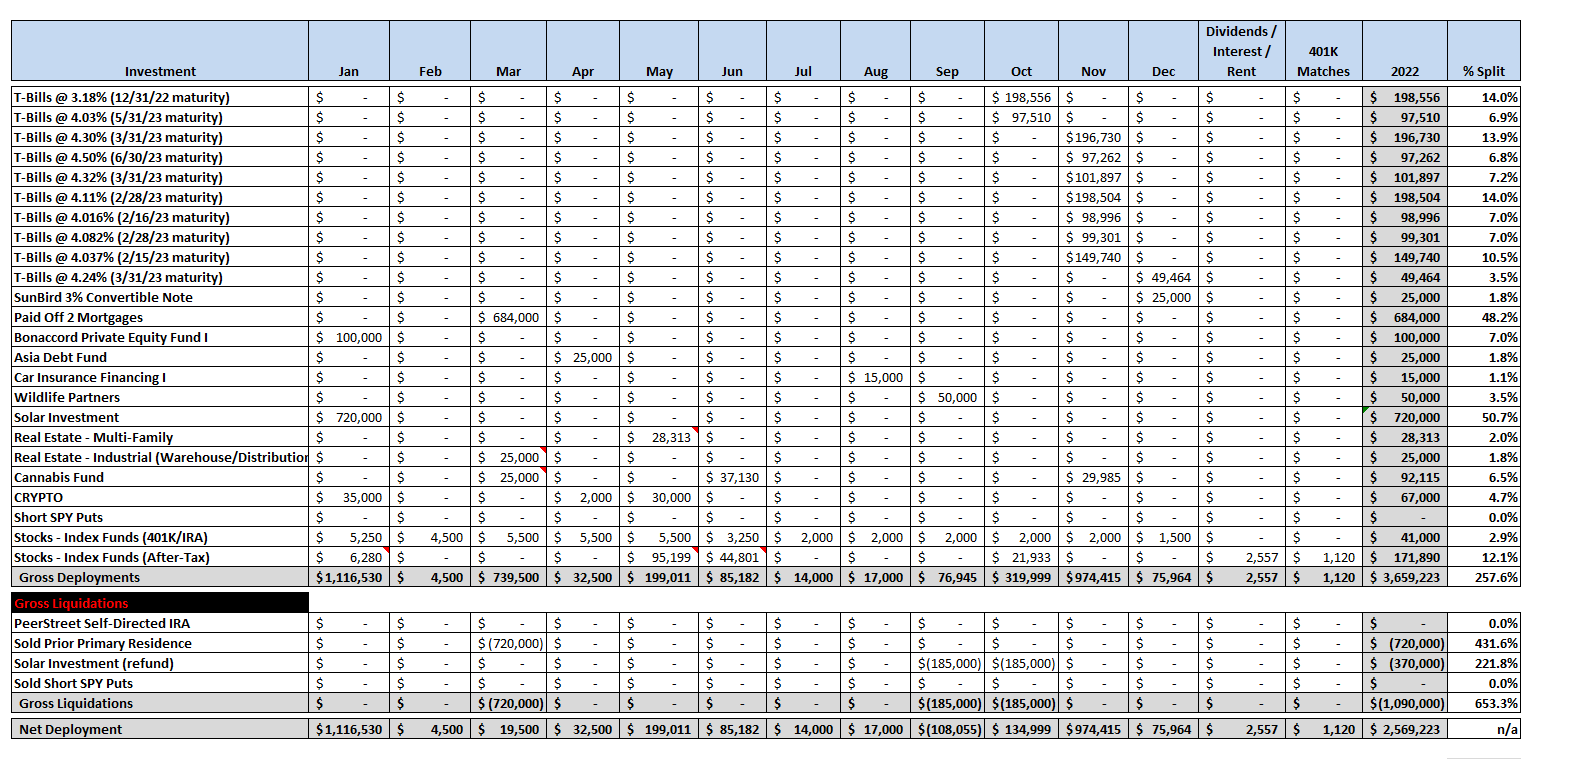
We ended up deploying ~$1.2M in the last quarter of the year and most of that was deployed into short-term treasuries. We did receive a capital call for close to $30,000 to continue funding our commitment to the Cannabis fund we are invested in, $5,500 went to max out my 401K, $22,000 was invested in index funds in our after-tax brokerage, and we invested in a convertible note for a new start-up.
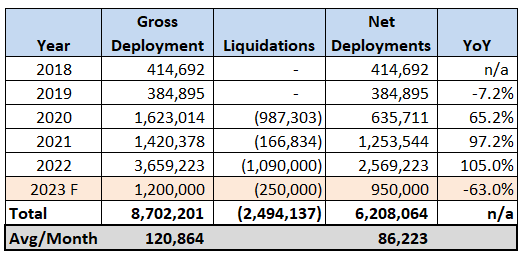
In the table below, you can see the history of the amount of capital we have deployed each year. We surpassed our target of $1.7M in net deployments this year but do expect a significant decrease in 2023. I have one particular investment in mind that I expect to lead to a liquidity event in 2023 if things go according to the current plan…only time will tell.
Closing Thoughts
This report and the completion of 2022 feels like the end of a chapter for the GYFG family. The story is far from over and really is just starting to get interesting. I’m excited to see where our adventure takes us in the months, years, and decades to come.
I wish you all a happy, healthy, and fulfilling year ahead.
Cheers,
– Gen Y Finance Guy
7 Responses
Can you explain how you are investing in short term treasuries please?
Hey Jon,
I am investing in short-term treasuries through my brokerage account at TD Ameritrade. You can also do it at the Treasury Direct website if you want as well. I’m currently managing maturities between 30 days and as long as 151 days out as I type this. I’ve essentially created a ladder that spreads maturities out over the next 1-6 months.
Dom
Hey Dom, I replied to your email last month, however this maybe the best place to ask a question. Can you share the consulting industry you started the recent business for a huge ROI starting with less than $300? Thanks so much in advance.
Just replied to your email, Richard.
But the industry is corporate performance management (CPM). We are a value add reseller of CPM software and we implement the software for our clients.
Great site
CONGRATS, DOM!!! IT’S OFFICIAL. 🙂
Thanks for sharing your journey with us all.
We’ll chat soon, my friend.