GYFG here checking in for the April monthly financial report. If you have been reading these reports for a while you will notice that I introduce each month with the same intro month after month. I do this for two reasons; a) for the newbies to the site (which make up about 50% of the sites traffic); and b) to remind everyone what these reports are all about. By all means if you have read the intro at least once, then please feel free to skip down to the “Summary of April 2017” section where the new content begins.
For those of you that are new around this corner of the internet, I wanted to fill you in as to what these reports are all about. These monthly reports are about full transparency. They are just as much for me as they are for you. It’s a hard decision to make all of your financial details public, but it’s also a very motivating one. It’s not just the post, but the process of putting this post together that really benefits me.
My sincere hope is that my transparency will inspire you to take the helm of your own financial ship and be intentional with its direction. I truly believe that anyone can reach financial freedom, if they are willing to do things differently. If you earn an average salary and have an average savings rate, then you can expect an average result! That means you will likely have to work at a job you may or may not enjoy until you’re 65 and then maybe you can retire IF you’re lucky.
Hey, there is nothing wrong with average. If you’re happy with average, then by all means keep doing what everyone else is doing. Not sure how you feel about that, but I have no interest in living an average life. I want EXTRAORDINARY.
Most people don’t want to live below their means in order to reach FINANCIAL FREEDOM, because that’s painful. They think it involves cutting out all the joy in life. You know what I’m talking about, those financial gurus that tell you that in order to get rich you need to cut out the $5 lattes and stop going out to eat. Then after 40 years of diligent and above average savings and super low spending, you will be a millionaire. Basically, you have to live like a college student and suppress all the things you want to do in life and then when you’re old you will be rich.
Okay, that doesn’t sound like the plan for me either.
The good news is there is another way. This site and these reports are here to show you the OTHER path to financial freedom. There is a way where you can have your cake and eat it too. I believe and hope that over time I will be able to convince you of the following:
In order to reach financial freedom you can choose to live below your means by cutting expenses to the bone and living in a state of scarcity or you can expand your means and live in a state of abundance by increasing your income and enjoying the $5 latte or other indulgence of your choice.
Not only that, but if you’re diligent you can reach financial freedom a lot sooner than anyone has ever led you to believe.
Our Mission Statement:
To Humanize Finance, Build Wealth, and Reach Financial Freedom.
I know I don’t have to publish my juicy details every month, but it’s important to me that you know that I put my money where my mouth is (because not that many finance blogs or people giving financial advice do this). I publish all of my financial details not to brag, but instead to show you what is working as well as what’s not working. Sometimes finance can get pretty dense, but I think real life examples and numbers can help slice through the complexities (and BS). Personally, I have always enjoyed the financial reports put out by other bloggers around the blogosphere.
As always, you can find all my previous reports on the Financial Stats page (as well as annual trends and a few other financial metrics not found on this report). In these monthly reports the plan is to give you a month over month update on Gross Income, Assets, Liabilities, Net Worth, Expenses, Contributions, Savings Rate, and progress on the mortgage pay down goal.
Summary of April 2017
Wonder how I pull all this information together every month?
Note: You may be wondering why I don’t use a bunch of screenshots from personal capital in these reports, and that is a fantastic question. As many of the other bloggers out there who use personal capital, post nothing but the graphics from within the application. I personally only use it as an aggregation that feeds into my own database that creates all the graphics you see in this post. The tool is fantastic, but I personally think the graphics are a bit limited, and prefer my visualizations.
We use Personal Capital to aggregate and consolidate our transactions from across all of our financial accounts (checking, savings, retirement, credit cards, mortgages, HSA, and other investment accounts). At the end of the month I export that information into my financial stats spreadsheet in order to produce this (beautiful) monthly report.
Tracking your finances is, in my opinion, the best way to stay on top of your finances. You can’t optimize what you don’t measure. You can’t make informed decisions if you don’t know what you having coming in vs. going out. Without a holistic view of how much you spend every month, there’s no way to set savings, debt repayment, or investment goals. It’s a financial freedom must!
If you don’t already have a FREE account with Personal Capital, stop reading and go sign up for your account right now! (Seriously, this financial update will be here when your done. There’s no time like the present to take action. You will thank me later!)
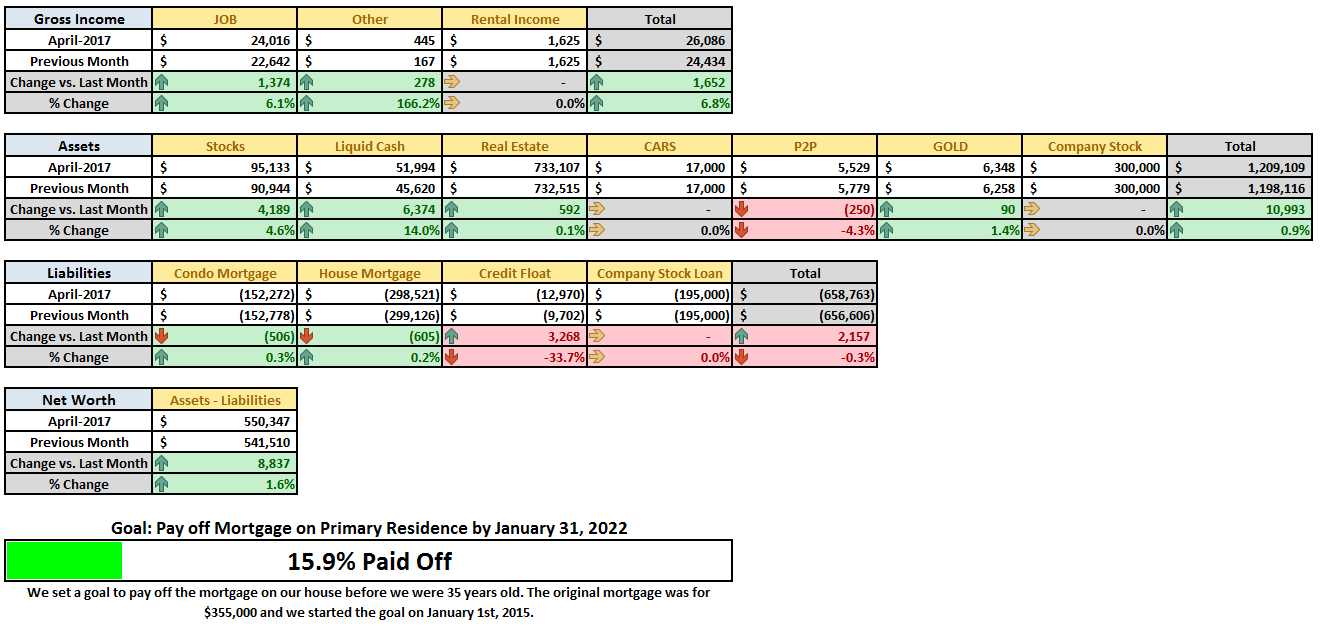
Month Over Month Financial Summary
Just three things to point out in case you missed it:
- Cash was up $6,374 or 14%. The goal is to continue building our cash stash through this summer.
- Stocks are up 4.6%; this will see a much larger increase in July when I pay back my 401K loan with my mid-year bonus.
- Credit Float is almost $13K due to timing of when the statement closes. It includes a lot of business related travel expenses. As a reminder, we pay our credit cards off in full every month, so this is just a timing issue. Our cash balance does reflect some of the reimbursements I have already received, but I still have about $3,000 outstanding. I also pre-payed for a beach house we plan to stay at over the memorial day weekend.
INCOME; What went down in April?
April Income = $26,086
- Previous Month: $24,434
- Difference: +$1,652
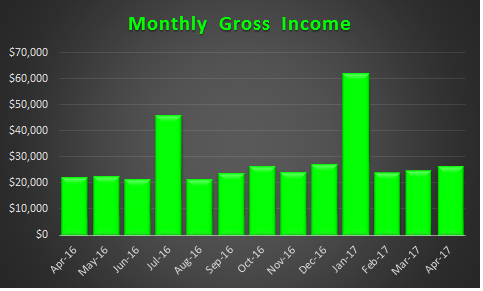
Here is a look at the trend for the last 13 months:
There really isn’t much excitement on the income front. We are in a rather tight band of $24,000 to $26,000 a month in income. I am actively working to try and increase the income that is being generated from this site, but that is a post for another day (we are over due for a blog update).
Now where did all that money go?
I have come to the realization that there are always going to be unplanned expenses. Our goal is to save 50% of our income and live off and enjoy the difference guilt free. With that type of rule governing our financial life, it is a free pass to inflate our lifestyle, but only proportional to our income. You can see prior financial reports here. We do however try to line up expenses with expected income as much as possible.
Last month I wrote “we do have a few larger expenses hitting in April, but I still have us forecasted at around $8,100 for the month,” woops! There are a few contributing factors that I did not account for when I wrote this last month:
- I have about $2,200 in business related travel expenses that won’t hit my account until May based on the timing of submitting my expense report.
- I booked a Beach House for Memorial day weekend, and that set us back about $3,600 (but look at those pictures of the place):
I know you’re probably thinking that I’m crazy for paying $900/night to rent this place, but I’m not even going to try and justify it. One of our longer term goals is to spend 3 months every year living by the water, and this is our attempt at dipping our toes (pun intended).
If I get the timing right our May expenses should more than offset this unexpected spike, which based on my travel schedule for May, it shouldn’t be a problem. This means our expenses for May will be a record low of around $6,500.
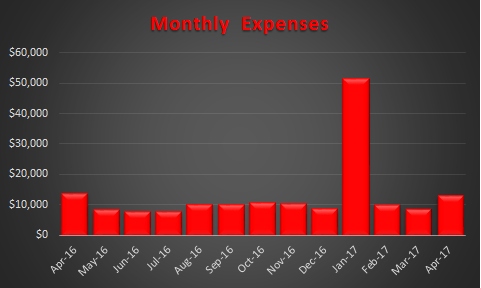
Here is the trend for the last 13 months:
Note: I have now changed the chart to reflect the add-back of loan amortizations to reflect what I call “real spending” above. This is done because amortizations are really just a balance sheet transfer from cash to pay down liabilities, it has no impact to net worth.
That spike is going to haunt me for the next 12 months, but it is also going to be a constant reminder to keep spending in check for the remainder of the year in order to achieve our savings and net worth goals. It really makes our spending look small in context of the big spike 🙂 . We are currently projecting our spending at $133,000 for the year vs. our original budget of $112,000 (and vs. 2016 at $121,000).
CALL OUT: It is crazy how slippery money can be. Because of this I totally recommend you automate as much of your finances as possible, especially the saving and investing piece. We set our financial goals at the beginning of the year and then automate the process of reaching them.
Examples:
Our mortgage payment is automatically set up to pay $1,600 in additional principal.This is on hold until at least June 2017. Trying to work down concentration to something closer to 20%.- My 401K contribution is automatically deducted at a rate that will ensure I max out by year end ($18,000)
- My HSA contribution is automatically deducted at a rate that will ensure I max out by year end ($6,750)
- We are now sending $500/month to our Rich Uncles investment account. Looking to increase the account balance to $11,000 by year end (currently at $5,500)
We are now sending $2,000/month to ourPeerStreetinvestment account.We now have $57,000 invested here and are on hold from new monthly investments, but we may transfer another $20K in from an old IRA over the next couple of months.
All of these things take priority over any spending that we do in a given month. We monitor expenses but don’t really manage them. Instead we manage savings and investments and let the expenses work themselves out.
Savings Rate
Below is how we did vs. our goal of saving 50% of our after tax income.
You can see that although our goal for the year is 50%, we bounce all over the place on a monthly basis.
Speaking of savings rate, have you checked out my post where I mathematically prove the importance of your savings rate as a higher priority than the compound return? If you’re trying to build wealth quickly, then you have to read this post.
Net Worth and Mortgage Pay Down Update
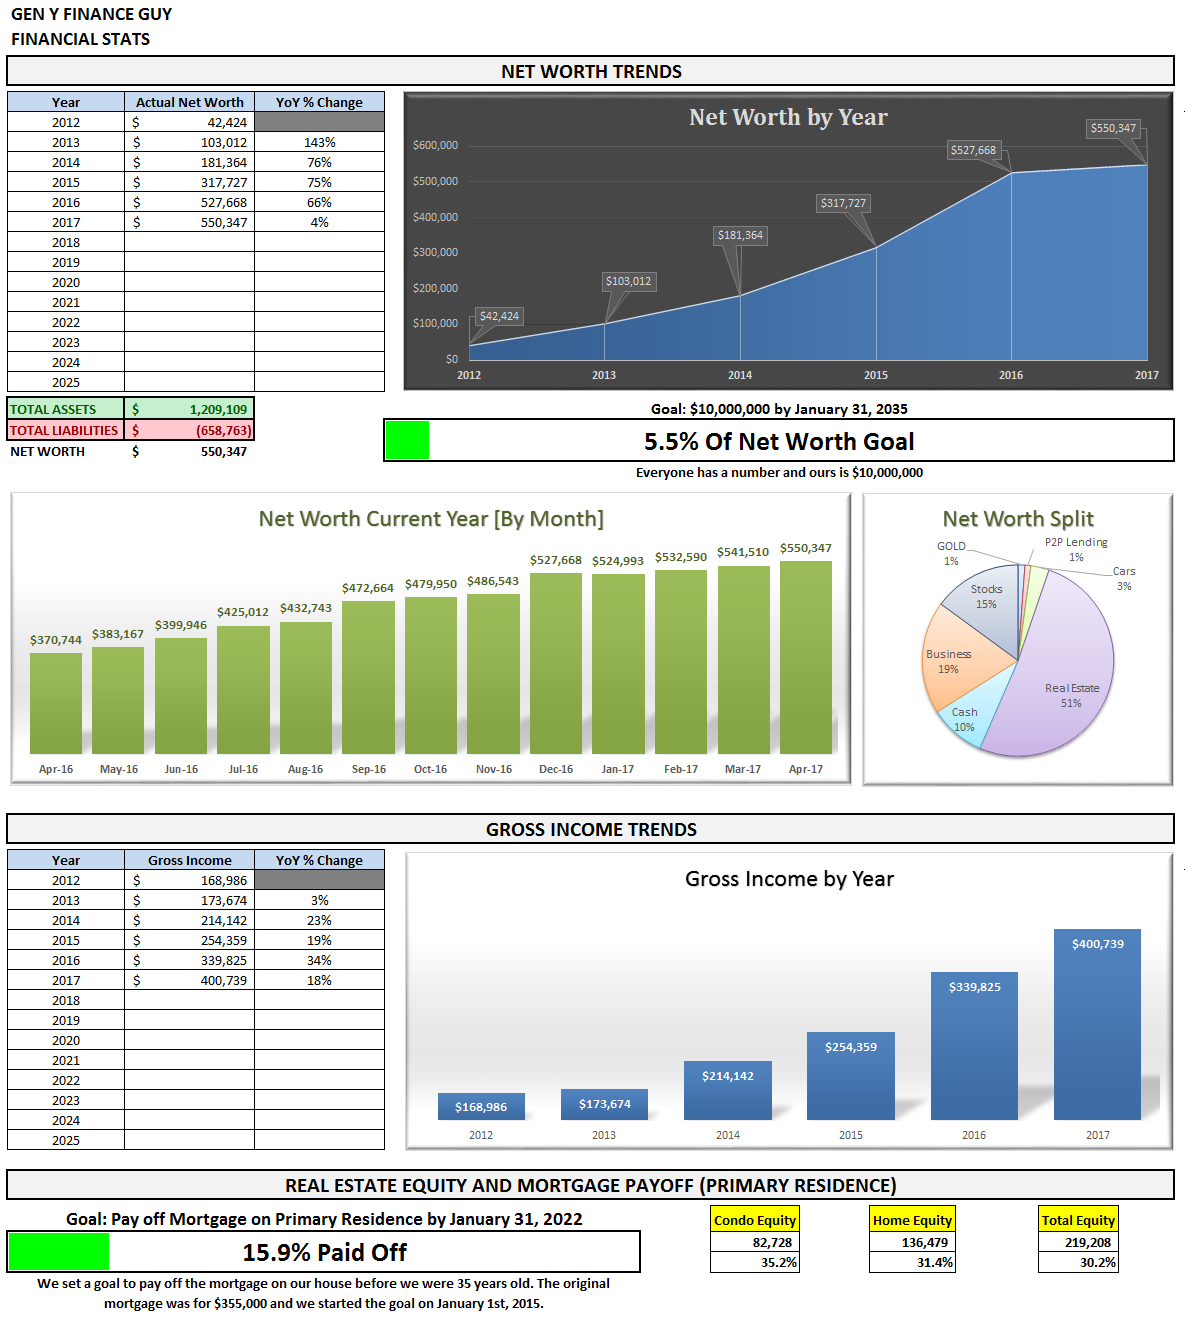
My ultimate goal is to build up a Net Worth of $10M returning 6% a year or $50,000/month in gross income. Don’t freak out, this is only about $5.5M in today’s dollars when you take into account a 3% inflation rate. If you want to see how I plan to get there you can read all about it here.
April Net Worth $550,347 (up +4.3% for 2017 YTD)
- Previous month: $541,510
- Difference: +$8,837
Net Worth is up 1,197% since 2012!
Net Worth Component Break Down:
In January, I added a new “Business” category that reflects our recent $105K equity investment. I only plan to adjust the value of this particular holding once per year, based on the same model we use internally at the company.
The real estate category also now includes $57,000 (a little over 10% of net worth) I invested in hard money loans through PeerStreet. Only $7,000 of this sits in an after-tax account, while the remaining amount is sitting in a newly created self-directed IRA. Since I don’t need the cashflow right now, I figured it would be best keep the majority of my investment in a tax-sheltered account, especially since the gains are taxed at ordinary income rates. This may increase by about $20,000 in coming months as mentioned above.
I expect to see cash to grow to a larger percentage overall as we move throughout the rest of 2017. I like seeing that the value of our cars are only making up 3% of our net worth now, there was a time that they made up way more than they should have, which is the reason I even include them in the net worth calculation.
Note: I think people tend to glaze over the fact that the savings rate plays a much bigger role in increasing your net worth than the rate of return on your investments (in the early days of your journey). In the short term, savings rate has a bigger impact on net worth. The goal is to eventually build a big enough asset base that the gains from compounding will eventually outpace the gains from savings. Actually, check out the post I recently wrote: Savings Rate – The Most Important Variable to Wealth Building [and the math to prove it]
Progress On Our Mortgage Payoff Goal
You can read about our strategy to pay off our mortgage in 7 years (and 3 months). After several refinances we currently have a 3/1 ARM at 2.25% and we currently owe $299,126. It is nice to see it go under $300K.
Our primary residence is currently sitting at 24.8% of our net worth, still higher than we would like, which is why we have not made any additional mortgage payments this year. We would like to see this closer to 20% in the short term and far less in the longer term. That is not to say that we don’t still plan to stick to our 7-year goal to have it paid off, we just feel more comfortable stacking up the cash in our bank account.
The End
I hope these reports inspire and move you to action. Don’t take a passive role in your finances and hope for the best. There is a famous Jim Rohn quote that I think everyone should keep in mind:
If you don’t plan your future, somebody else will. And you know what they have planned for you? NOT MUCH!
You have to be intentional with your finances if you ever want a fighting chance to make it to financial freedom. It doesn’t have to take 40-50 years of slaving away for the man before you have the option to retire. I personally think that 15-20 years is really all you need, and for the folks that are more aggressive (i.e. extremely frugal, not us) or very high earners you can probably reach financial independence in 10 years or less (maybe us, it’s yet to be seen but income is our focus vs. expenses).
I am looking forward to chatting with you all in the comments below. How was your month? Also, if you have a blog, I encourage you to write a monthly financial report and come back here and share the link. I would love to be part of your support and accountability.
One last thing before we go. If you are new or even if you’re not new and you have been wanting a more guided tour of the blog, I finally launched a “Start Here” page. I highly recommend you check it out.
Cheers!
– Gen Y Finance Guy


7 Responses
That beach house looks awesome. I want to buy a lodge in Colorado one day that faces the bottom of a ski slope.
Troy – that would be amazing!
That is excellent, well done to you. You have done well for yourself.
Cheers
Thanks!
Wow that beach house!!
That’s a pretty dope house, my friend! Nice work keeping the savings consistent. Hope all works out with that equity position. It’s great you can have a direct effect on it as an intrapreneur. Keep up the momentum!
Hey Michael – I am still in shock that I can even rent something like this. It’s definitely a cool house in a very cool location.
The equity position has a long way to go before I know how that works out, but I am optimistic. Based on the formula we use internally, the position is currently up about 4.5%, but I only plan to update the value once a year in January.
Hope all is well!