

I’ve been itching to write this post for some time. I really can’t believe it’s been four years since I announced publicly that the GYFG household was chasing such an ambitious goal – a $10M net worth in twenty years. I received a lot of doubt at the time, which is understandable, because for most people this is a goal beyond the realm of possibilities – either by circumstance or their own self-limiting beliefs. I get that the income levels required to achieve such a BHAG are insane, but to me, they were never impossible.
I see the world through a different lens. I credit a lot of this ability to The Slight Edge
This is all to say that from an outsider’s perspective, I totally understand the low level of confidence that greeted this goal when it was first published. I wasn’t surprised at all and had expected people to doubt me. I was actually counting on that skepticism to fuel my ambition to achieve. That’s not because I take joy in proving people wrong but instead because I take joy in proving perceived impossible as being possible. You have to first think big before you can achieve big. Only then will you experience The Magic of Thinking Big
What Was The Starting Point?
Back in 2015, I had just started the blog about four months prior to publishing the original blueprint to $10M. A lot of my philosophies that I now practice and preach here on the blog were a result of refining a strategy that would allow my wife and I to achieve such a BIG goal. Notably, I realized that I needed to focus on the two big areas that were in my control: earning and saving. I was convinced early on that a high income was the surest path to a high net worth. But I also realized that income did not equal wealth and that a high savings rate needed to be paired with that high income. Thus the law of 50/50 was born, that states we save 50% of all after-tax income which allows us to spend the remaining 50% guilt-free.
Prior to this, we had recently finished 2014 with a net worth of $181,364 (full net worth history here). As we headed into 2015 we had projected our total gross income to be $178,800. Humble beginnings! I mean, we only had to increase our net worth by $9,818,636 over the next twenty years (or $490,932 per year on average). We had some serious ground to cover and it needed to happen quickly.
The Original Blueprint Summary
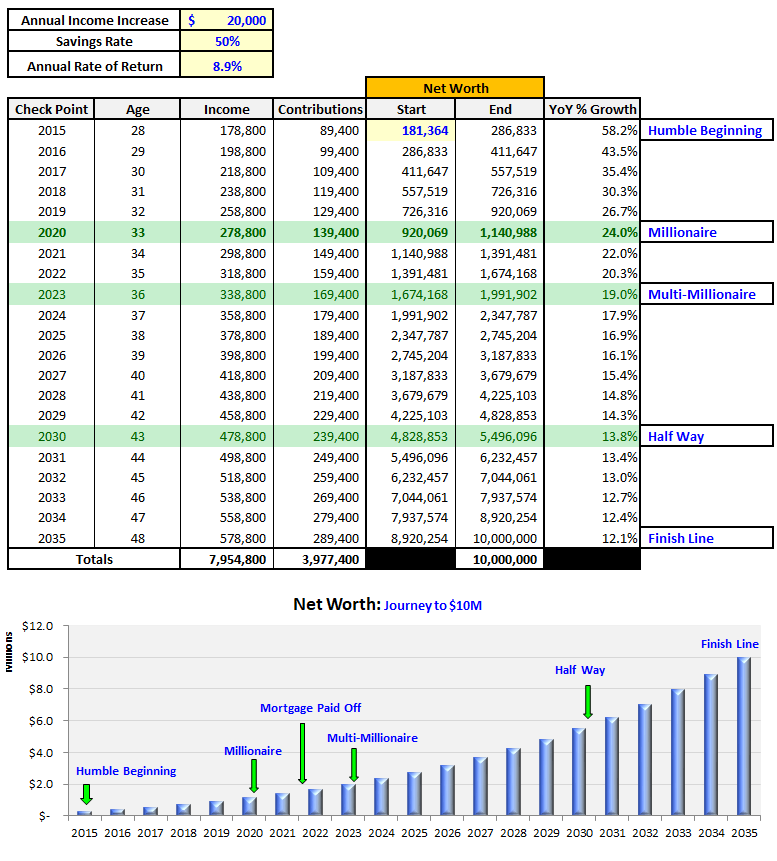
This plan was based on three major assumptions:
(1) Achieving a gross savings rate of 50%.
(2) Increasing our gross income by $20,000 every year.
(3) Earning an 8.9% compound return.
This blueprint was far from perfect when it was first constructed. Two of the three assumptions have proved to be too aggressive (#1 and #3), while the income assumption ended up being very conservative. The model and the assumptions have been refined over the past four years (and will continue to be refined and tweaked over the final 16). I originally entered our starting net worth incorrectly in the first pass (having made January 2015 the starting net worth rather than December 2014 – the real starting point). The mistake was not material (only a $10K difference) but has since been updated in the above summary.
The real magic of putting a long term plan like this together is not that you get every assumption right. That is impossible. The magic is in planting the seeds in your subconscious to start working on ways to get you to your desired destination. You have to think big before you can achieve big! This kind of plan opens your mind to recognize opportunities it wouldn’t have known to look for previously.
None of us can really control the returns we earn on our savings and investments and we realized this early on. So, we got very aggressive in growing our income and savings rate – as you will soon see below.
Four Years Later
Four years represents 20% of the time allotted to achieve our $10M goal. Yet, as you will see we have only reached the 10% milestone. Our net worth finished 2018 at $1,012,865. But we are not concerned because we have built momentum that will soon go exponential. We are moving closer to the inflection point where the gains from our investments will outpace our contributions. I’ve argued for some time that your savings rate is most important in the early years of your financial journey because the magic of compounding takes about a decade before you really start experiencing its full force. And it only gets stronger with time.
The first $1M in net worth will take you the longest time to achieve. Each successive $1M should will take less and less time. My wife and I graduated from college in 2008, which is the year I start the clock for our first $1M in net worth. So, it took us ten years from graduating college before we hit our first $1M in net worth. I estimate that the next $1M milestone will happen in 3-4 years. And the next will only take 2-3 years. And so on…
Let’s take a look at how our actual performance compares against the original plan for some key metrics and then we will take a look at the refined model that will guide us over the remaining 16 years.
Gross Income Actual vs. Plan

I significantly underestimated our ability to increase our earnings so rapidly. The increases in our income from year to year have exceeded – and continue to exceed – our wildest expectations. If you look back up at the original assumption, we assumed that we would be able to increase our income by $20,000 per year. We blew that assumption out of the water!
Here are the favorable variances we realized over the past four years vs. the plan:
2015 = $75,559
2016 = $140,200
2017 = $153,677
2018 = $236,945
Cumulative = $606,381 ($1,441,581 Actual vs. $835,200 Plan)
I’m currently projecting an income of around $500,000 for 2019, which, if achieved, will put our income about 13 years ahead of schedule (projected in year 17 of the initial 20-year plan).
I think this GIF says it all!

Gross Savings Rate Actual vs. Plan

For those that have been following along for some time, you know that the savings rate I share in my monthly financial reports is actually my after-tax savings rate. Although I track both, I share the after-tax number because I feel it is more relatable for people since everyone’s tax situation is different. I also hadn’t really contemplated taxes much when I put this plan together. My thought at the time was that taxes were a non-controllable assumption. That said, I should have realized that at the income levels I had projected, and with the majority of the income early on coming in the form of earned income, taxes were going to take a big bite out of the gross income.
Due to this lack of foresight, you can see that we have significantly underachieved our original goal of saving 50% of our gross income. Although 2018 was a step in the right direction, I think the only way we are going to ever get to a 50% pre-tax savings rate is by diversifying more of our income to more tax-favorable tax streams, i.e., income not taxed at ordinary income rates (long term investment gains and qualified dividends) or income streams with lots of tax shields (rental real estate is the only one I’m currently aware of).
One thing that is interesting to note is that of the additional $606,381 that we earned above and beyond the plan, only $133,058 was saved (at the 50% goal, we should have saved $300K). A big chunk of those expenditures went to taxes and the remaining was spent on who knows what (I do track it all, but I won’t get into it here – you get the point).
Net Worth Actual vs. Plan

The primary driver in growing our net worth faster than planned is income. Our ending net worth of $1,012,865 in 2018 is currently 39.5% ahead of plan ($726,316). I’ve already pointed out that we missed our 50% gross savings rate goal and although I don’t have the data, I don’t think we have earned an 8.9% compounded rate on our investments. However, our investment gains have been larger in absolute dollar terms because we were able to put more money to work a lot sooner than originally projected.
I want to spend a bit more time dissecting the sources of our net worth growth from year to year in the next chart below.
Net Worth Growth By Source

(I love any excuse to put together a nice waterfall chart. To me, they are such an aesthetically pleasing visual.) I’ve tried to provide a simple picture that easily identifies the growth in net worth from year to year and how much growth came from contributions (savings) and how much came from gains (dividends, interest, 401K match, or appreciation of assets). I added in the annotations on the chart to provide a little more explanation that may not be easily conveyed in the chart alone. I’m pretty pleased with the outcome and I hope you are too.
I think this chart reiterates how important a role savings have played in the growth of our net worth over the last four years. Overall, savings have accounted for 66% of the growth over the four year period.
A few things/anomalies to point out:
(1) The $129,382 increase from contributions in 2015 includes $34,450 related to a late-add of our cars in our net worth calculation. This may seem odd but I didn’t want it to be included in the investment gains and I didn’t want to include a third bucket for a one-time occurrence. So, instead, I thought I would just point it out to you. Also, I decided to include cars in the net worth calculation in order to ensure they shrank as an overall percentage of our net worth. You can see that based on 2015 ending net worth, they accounted for 10.8%. Today, they account for less than 2% (ending value for cars in 2018 was $19,000).
(2) I use investment gains loosely to also include the increased value of our primary residence, which I know many would not classify as an investment. Nonetheless, it is an asset that does fluctuate in value and this is how I’m capturing it.
(3) A large majority of the $83,742 in investment gains in 2016 were driven by appreciating real estate values on the two properties we owned at the time. We have since sold our investment condo and are down to one property – our primary residence.
(4) The investment increase of $152,070 in 2018 was largely driven by an increase in value in the stock I own in the company I work for (about $129K increase in 2018).
Net Worth Gains – Contributions vs. Investment Gains
Before we move onto the refined blueprint for the next 16 years I would like to first evaluate the planned sources vs. what happened in reality. In the prior chart I provided the gains by source in absolute dollars but now I want to take a look at what the plan called for each source in percentage terms.

It looks like I got the trend right in that contributions have for the most part made up less and less of our overall gains in net worth. I suspect this will be lumpy in any given year but that the trend will continue to be made up of less gains (in percentage terms) coming from contributions and more coming from investment gains with each passing year. I do expect that there will likely be an inevitable down period that causes a year or several years to be composed of 100% contributions (or something close to it). I also expect net worth to decrease in at some point, which would cause a negative percentage from the gains side of the equation but we can deal with that when it comes.
Updated Blueprint for the Next 16 Years
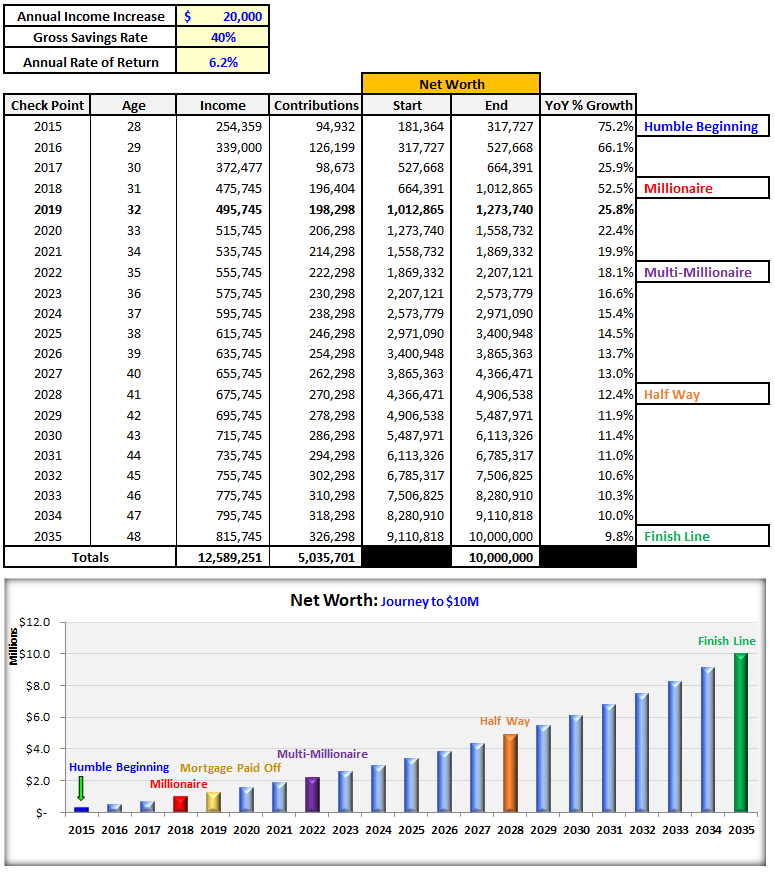
Every year I make a copy of the model and update the projections with actuals (which is what you see through 2018 in the above image). I then use the annual rate of return as the “plug” in order to goal-seek the ending value back to $10M. Until now, this has been the only variable I have fiddled with from year to year. In this updated model that I’m sharing above, I have also modified the gross savings rate by decreasing it from 50% down to a more realistic 40%. I have held the assumption that we will continue to be able to increase our gross income by $20,000 per year. In fact, I think this assumption becomes easier and easier, the more our income grows.
Our revised assumptions for the next 16 years:
(1) We will continue to be able to increase our income by $20,000 every year (from all sources).
(2) We will save 40% of our pre-tax income. Although I’ve changed this assumption, we will be working hard over the next five years to generate more income from streams with more favorable tax treatment in order to work our way towards a 50% gross savings rate – eventually.
(3) We will earn an annual rate of return of 6.2%. This seems much more achievable than the original 8.9% we had assumed.
With respect to #3 above, I would like to see our income and savings rate improve faster than planned in order to continue to drive this required rate lower and lower from a model perspective. But in an ideal world, we would see all three over-achieve the revised plan.
Although I’m sharing this revised plan, I will always hold myself accountable to the original plan. I probably won’t have another update like this post for another three to five years. I know that anything can happen in a year, so I’m more concerned with the overall trend, realizing that one year does not make a trend. I think it makes sense to take another look at this once our net worth reaches $2,000,000+.
Concluding Thoughts

For me, Tony Robbins sums it up well. I had originally read a similar quote attributed to Bill Gates and had that in mind when I first developed this blueprint. Understanding our human nature to underestimate what can happen in a decade is important so that you can compensate for it in your planning. You can capitalize on that knowledge by upgrading your pre-programmed ability to project linearly to being able to project exponentially (visualizing the power of compounding in all facets of life).
Please don’t misread this. The results don’t happen magically; they happen through taking action consistently over time. Taking daily action for a long enough period of time will allow the power of compounding to kick in. Most people quit way too soon. They quit “inches from riches.” But when the going gets tough, the tough keep going: when motivation wanes, discipline reigns.
The exponential lens gives you the tool to see as possible what looks impossible viewed through the linear lens. I believe that linear thinking is what holds people back from going hard enough after their dreams. Here’s an example: it took me seven years out of college to start earning $100,000 per year. Let’s say I had a goal of earning $350,000 per year. If I had projected this linearly I would have incorrectly concluded that it was going to take me another 17.5 years to get there, if I ever got there at all. But that’s not how the math really worked. In this real example, it only took me another four years to increase my compensation from $100,000 to $350,000 per year. That is the power of compounding!
I never gave up. I never got discouraged. I kept grinding it out. I knew that every overnight success was ten to twenty years in the making. That’s how I know we will hit our goal of $10M. When you take yourself off the linear track and onto the exponential track you had better buckle up because you are in for the ride of your life. You’ve just received your fast pass – to everything!
– Gen Y Finance Guy
22 Responses
Man, I love these recap posts. These last 4 years have been crazy to watch you grow as a person, and also see your wealth grow!
Thank you for sharing your story with us 🙂
Thank you for the inspiration! Onwards and upwards!
Thanks, Erik!
I appreciate you following along all these years. It has been awesome to watch your story unfold as well. BTW – great job on that monster resource you just released.
Dom
Awesome progress so far! I’m looking forward to watching you reach and (far!) exceed your goal! My goal is a bit more modest. Perhaps I should strive for more. 🙂
Thanks, Jon!
I appreciate your confidence in my achieving and exceeding my goal. What is your goal?
Really at this point it’s to reach a crossover point where my passive income safely exceeds expenses. We have a high cost lifestyle at this point. If we lived in a LCOL area, I’d be able to “retire” now. My goal is to reach that crossover point for my current lifestyle within the next year or so. At that point, we’ll see what I want to do, maybe negotiate a part-time situation with my employer or perhaps I’ll just go “full-time” with hobbies and passion projects. As for net worth, I’ll be happy to reach half your number. It’s definitely achievable likely within the next 10 years or so, even if/when I do “retire” early. But, I need to think about it some more and perhaps formalize a strategy to get there…
“Not everything that counts can be counted, and not everything that can be counted counts.” – Cameron
GYFG, you mentioned you were working on this post back in December, and I have been looking forward to it. It did not disappoint! I also like the aesthetic of the ‘waterfall chart’ you include in your posts, and have never seen it before your writing. Also loving the milestones you include on the right-hand side of your 16-year update.
If you ever start including Gantt charts for your milestones, my mind will explode like that awesome Terry Crews .gif!:-)
At one point in my own journey, I started backing out my (custom) inflation numbers, in order to use a ‘real dollar’ figure to compare. Turns out, it was pretty meaningless to me, because I was always on the ‘time now’ point in the graph!
Passing along some recently absorbed info you might find of interest, 1) Warren Buffett has just recently pointed out the risk for companies to be located in states that have high public-pension obligations; 2) Bill Gates has just, for the first time in his foundation’s history, approved investing in a ‘clean energy’ technology, being Gen IV Nuclear; 3) Vanguard has released it’s most recent 10-year forecast for market-and-inflation outlook. Under 2% for inflation, thanks to Amazon and boomer retirement spending. U.S. equities 3-5%, including dividends. Global Equities 3.5-6.5% including dividends. Hope these are of interest!
JayCeezy – I’m glad I didn’t overpromise. I thought you would enjoy this piece. I’m not sure I will be using Gantt charts anytime soon but noted.
I’m most interested in the Vanguard 10-year forecast.
Any general conclusions or insights you care to share after sifting through these various updates?
Dom
GYFG, two links to the Vanguard 10-year forecast…also, I was just kidding about the Gantt stuff. As a goof, for a long time I had a Gantt chart above my desk showing Birth, School, Work, and Death. Four milestones and three bars over 95 years. Plan vs. Actual. Not everyone found it useful.;-)
The first link really tamps down investor expectations, invoking regression-to-the-mean. https://pressroom.vanguard.com/news/Press-Release-Vanguard-Unveils-2019-Economic-and-Market-Outlook-120618.html
(4 min. video) The second is a short presentation hitting the big points. You will have to let me know your thoughts. Your 6.8% meets the smell-test, and at some point you will rebaseline again (and again). Still, interesting data with pro analysis, I’m most interested in it, too! https://advisors.vanguard.com/VGApp/iip/site/advisor/researchcommentary/article/IWE_InvComWhtRlRtnStkBndsNxTnYrs?cmpgn=SM:FAS:POST:070518:TW:XX:XX:XX:sf192612203&sf192612203=1
P.S. – last year you may recall my Fed-and-State tax rate was 6.3% of AGI. Just finished 2018 taxes, and it is 4.7%. I’m almost a tax-avoidance Gangsta!
I’m curious how you keep your taxes so low. Do you have minimal earned income? Is your income from real-estate? Is it from tax-free munis?
I agree about the Vanguard 10-year forecast. If they are forecasting 3-5% annual returns, and the S&P 500 currently yields almost exactly 2%, then the reality is that 100% of the return will be from dividends. That’s because there will be a market pullback (or multiple pullbacks) over the next 10 years. The 2% dividend yield will be invested at lower valuations, so even if the price of the S&P 500 is the same in 10 years as today, you’ll end up with 3-5% annual returns.
That’s a far cry from what most people have gotten accustomed to over the last 10 years.
They are basically forecasting that all of the gains will be from dividends, with the expectation that there will be a big drop in market value sometime in the next 10 years which will allow the
Hi TMC, your question intrigues me. Mainly, because nobody has ever asked me that before. Short answer, my wonderful wife and I have no earned income. We are strategically realizing Long-Term Capital Gains each year, and for 2018 one can realize $77,400 in LTC and pay a 0% rate. Our tax-minimization strategy has worked well for a few years, and we expect to continue with it for a few more.
Your own TMC site is very impressive, and I’m not surprised you are a professional with a CFP certification. Quick joke I hope you like: “Santa Barbara is the city where old people go to visit their parents.” So I’m sure your region is target-rich for potential clients.
I’m not a blogger, just a reader. I’m a boomer, who got intrigued by GYFG’s story and I like to read his work. This is my GYFG Freedom Fighter guest post here.
And this is my quick-and-dirty roadmap for regular people that are getting through this life without the benefit of a high-profile, high-paying job. So, one way to get out of the rat-race by 50 is found here.
Of the many market analyses I follow on the regular, Vanguard stands out for their truth-bullets. Most of the other stuff is a sales-pitch disguised as sexy wisdom. Dom has shared many books and financial articles with his readers, and I just wanted to reciprocate a bit and pitch in. We shall see, in the fullness of time. Be well!
Thanks for the reply. Your joke is right on target – a large portion of the population is the newly wed and the nearly dead. Students attend UC Santa Barbara, love the city, and stick around for a few years before they decide the area is just too expensive. The people who move back to Santa Barbara are usually older (and richer) so they can afford the cost of living here.
The story for avoiding taxes on long-term capital gains (and qualified dividends) is actually even better than what you said. As you pointed out, in 2018 you could earn up to $77,400 ($78,950 in 2019) and pay 0% LTC gains. However, you’re forgetting that married couples get a $24,000 ($24,400 in 2019) standard deduction.
That means you can actually earn a total of $101,400 in 2018 and $103,350 in 2019 without paying any LTC gains or dividends (assuming no other income, of course).
I advise clients to take a long look at munis and real estate investments as ways to earn tax-free income.
It’s always surprising to me that our tax code disincentives earned income. It would be much better for our economy if we had incentives for earned income rather than disincentives.
It is pretty amazing when you think about it. You can earn $103,350 tax free if it comes from qualified dividends and/or LTC gains. It’s too bad that you still have to pay taxes in California based on the progressive table.
GYFG, some good news is that the State Income tax for CA on $103K in LTCG is about $3,400. As we have discussed, what would it take for you to leave Cali? As you humorously reminded me, you and Mrs. GYFG save twice that just on family babysitting!;-)
In any event, thanks again for sharing your assumptions and path for your BHAG!
Awesome post and it’s just what I needed to sit down and revamp our NW forecast files. We are on a similar path though somewhat of less exponential chart 😉 The original goal at 25 (~$145K) was to get to $4M at 50 which I think would be a good estimated amount to put us at FI in our situation. It’s been a while since I’ve dusted off my model and gone to a deep dive so thanks for the motivation!
We are still on the path to $4M by 50, but your post definitely gets me to thinking… why not us… need to examine my assumptions to see if that 50 becomes a smaller number! And if not maybe it’s time to take some steps to make it happen!
-TFG
Fire Guy – I feel like it’s been a while since I’ve seen any new content from you. Glad to see you’re doing well.
HUGE post!
I love seeing how the contributions significantly drive up your net worth. It is comforting to see since I have the same philosophy.
Way to go Dom!
Thanks, Church!
Income is the only secret weapon I have in building wealth rapidly – paired with a high savings rate though.
I’m 42 years old and our net worth is $5.4M.
In your table you project that in the year 2029 you’ll be 42, and your net worth will be $5.5M.
This is totally awesome – I don’t have to do my own calculations any more – I can just use your tables to project my future net worth!
You make more money than I do though, so instead of 6 years I’m going to estimate that it will take me 10 years to hit $10M.
A spreadsheet always makes these types of goals seem so easy. The hard part is actually executing the plan!