

Zoom! Did you hear that? That was the sound of November flying by.
I’m writing this after returning from a long Thanksgiving weekend at the lake filled with lots of food, family, and fun. It was baby GYFG’s first time out at the lake but it won’t be his last. Mrs. GYFG’s parents have a houseboat and this annual trip during the Thanksgiving holiday has been a tradition for years. I love being out there in the middle of nowhere: so helpful for someone like me who has a hard time disconnecting. There is no internet or cell reception even if I wanted it, which is actually very liberating.
The pace of November was much slower by design. Not only am I nearing the final days of my W-2 employment but I have intentionally taken the foot off the accelerator on my business side of the equation in order to coast into the new year. This has been well received by the team I’ve built as they get to really enjoy the holidays with a very manageable and more flexible workload. In terms of topline revenue, this means about a 33% drop from where we were running the prior three months. December will follow the same pace as we take a few more deep breaths to prepare for an epic 2020.
Oh – I almost forgot to mention – our little man started walking last month after turning 13 months. This seems to be about the average age for boys to start walking based on the feedback I’ve received from other parents. Mrs. GYFG and I toured a pre-school/daycare that we really like, and intend to enroll him there starting in January or February of next year, which will give him great opportunities for socialization with other kids (plus plenty of germs to build that immune system – LOL) as well as activities to help with this critical time during his development of new skills and experiences.
November was a rather uneventful month on the financial side of the equation but we did see an increase in net worth of about $32,000 or 2.4%. Per usual, we will dive into the details below.
If you’re a regular reader and only want to read the new content, feel free to just skip the intro below, and head to Net Worth. If you are new or haven’t read many of these reports, I encourage you to take two minutes to read the intro below, which does change periodically.
Why I Share These Monthly Reports
Mission Statement: To Humanize Finance, Build Wealth, and Reach Financial Freedom.
For those of you new around this corner of the internet, these monthly reports are about full transparency. And, they are just as much for me as they are for you. It was a hard decision to make all of my financial details public, but it has proved to be a very motivating one. The process I go through every month to produce these reports has been enlightening and life-changing. I published my first “income and net worth report” for January of 2015 when our net worth was only $195,141 and our gross income was on pace to hit $178,000 that year.
Four years and eleven months later, our net worth currently clocks in at $1,374,308 with a gross income over the trailing twelve months of $704,553.
- That’s a 7.0X increase in net worth due to a compound annual growth rate of roughly 49% for the past five years.
- At the same time, income has increased 3.1X, which translates to a compound annual growth rate of roughly 26%.
Honestly, I don’t think the GYFG household would have experienced these kinds of results without the existence of this blog and the accountability it brings. Knowing that I will share our results with you readers every month keeps me very focused and intentional with all things related to our financial well being. For that, I THANK YOU for taking the time to read and interact with me on this blog.
Above and beyond this benefit to my own household, my sincere hope is that my policy of full transparency will inspire you to take the helm of your own financial ship and be intentional with its direction. I truly believe that anyone can reach financial freedom if he or she is willing to do things differently than the pack does. If you’re after average results, then you’ve landed on the wrong site. There’s nothing wrong with average, but the kind of results I preach are EXTRAORDINARY. Sure, the “get rich slow” method is proven, but there is an alternative, which is to “get rich fast.” Look, I have no interest in living like a starving college student until I am old and brittle to only then have the means to check off bucket-list items when my body might no longer be physically capable of doing them. And I don’t want that for you either!
Here at GYFG, we approach the pursuit of FINANCIAL FREEDOM with an abundance mindset, so you won’t hear me telling you to cut out those $5 lattes. Choose to spend on what is meaningful to you. I spend a lot, but I also strategically earn a lot, save a lot and invest a lot.
I hope these reports inspire and move you to action. Don’t take a passive role in your finances and hope for the best. Keep this famous Jim Rohn quote in mind:
“If you don’t plan your future, somebody else will. And you know what they have planned for you? NOT MUCH!”
You must be intentional with your finances if you ever want a fighting chance to make it to financial freedom. But it does not have to take 40-50 years of slaving away for “The Man” before you have the option to retire. I think 10-20 years is all you need, with the most aggressive folks probably able to reach financial freedom in 10 years or less. A high income paired with a high savings rate are two of the vital components of a good recipe for the 10-year track.
I know I don’t have to publish my juicy details every month, but it’s important to me that you know that I put my money where my mouth is (not so many people giving financial advice actually do this). I publish all of my financial details not to brag, but instead to show you what is working as well as what’s not working. Sometimes finance can get pretty dense, and I think real life examples and numbers can help slice through the complexities (and the BS). Personally, I have always enjoyed the financial reports put out by other bloggers around the blogosphere, so I always intended to share my own.
You can find all my previous reports on the Financial Stats page.
Financial Stats Dashboard
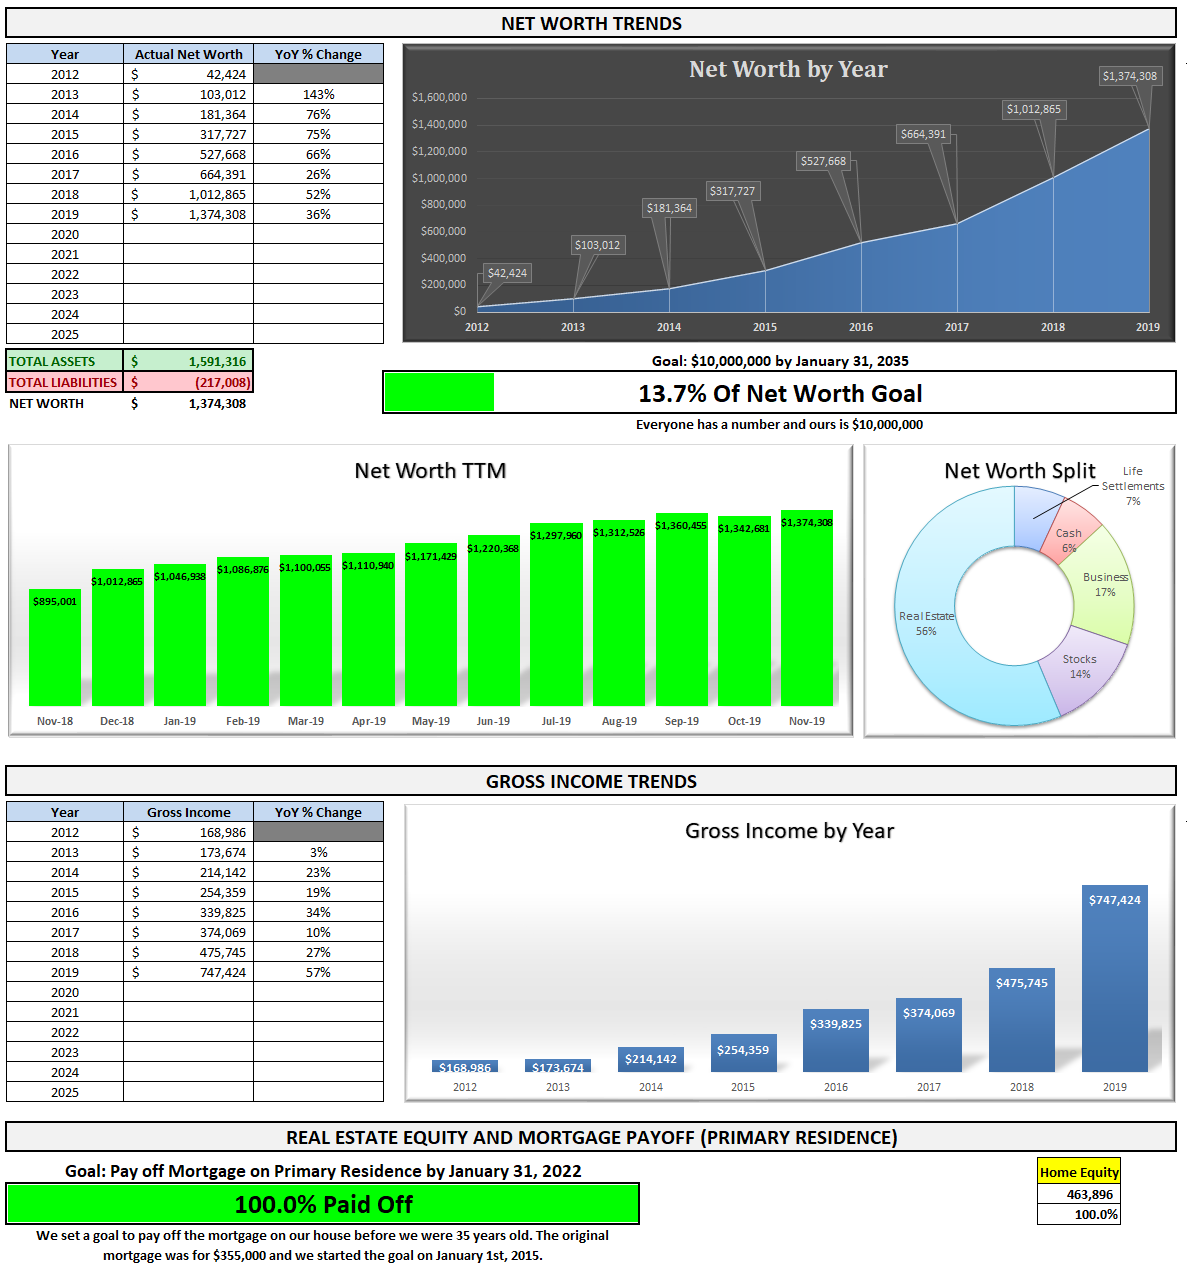
At the end of each month, I download a .csv file from my Personal Capital account and drop it into my custom built Excel workbook in order to update the dashboard you see below. I’m blown away every month by the progress we have made in a relatively short period of time.The only number below that is not an actual number and instead is a forecast is the current year projected income of $747,424 (up from $666,992 last month) in the gross income chart below.
Now that we have seen the overall, let’s take a closer look at a few of the items below.
Net Worth
As I type, I realize that I forgot to capture the cash value of the whole life insurance policy that I picked up in October for baby GYFG. With one month to go I’m currently projecting our net worth to close the year around $1,600,000 (give or take). The majority of the increase will come from updating the value of the private stock position that I hold. That will put us on track for a net worth increase of roughly $600,000 or 60% for the year. We will be gunning for $2,000,000 in 2020, which will catapult us to the fourth milestone of The Five Major Milestones to Financial Independence.
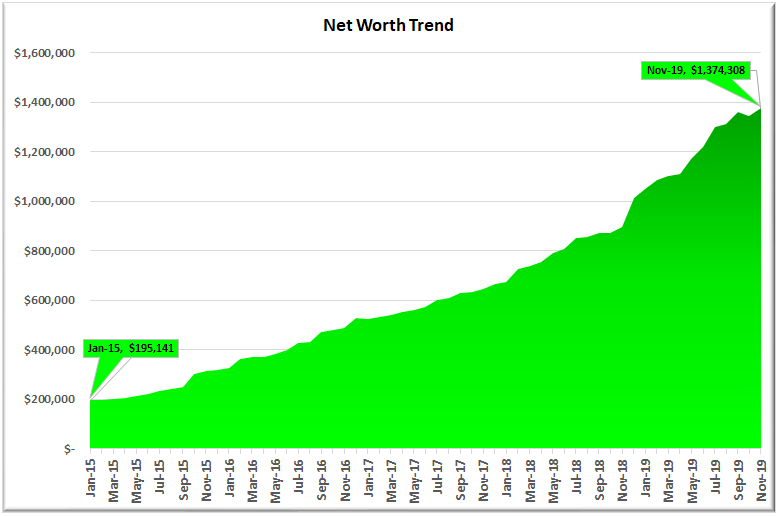
November Net Worth $1,374,308 (up $361,443 or +35.7% for 2019)
- Previous month: $1,342,681
- Difference: $31,627
Net Worth Break Down (MoM):
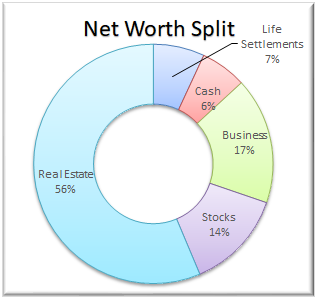 The Real Estate ($774,350) category increased from 53% to 56%. This category includes the equity in our primary residence ($463,896), a new hard money loan we extended in the amount of $150,000 at a 10% interest rate ($133,000 net of HELOC Loan – we will pay the remaining $17,000 back in December), our investment in the Rich Uncles commercial REIT ($76,672), and our hard money loans through the PeerStreet ($100,782) platform. There was no increase in Rich Uncles as they have put a freeze on reinvestment and new investment until January. PeerStreet has come down as I withdraw funds from the after-tax lending account, that will eventually make their way to Rich Uncles until it hits a six-figure balance.
Net Cash ($85,594) decreased from 9% to 6%. We actually have $90,602 in cash but net cash is only $85,594 after you adjust for our current credit card balance of $5,008, which we pay in full every month based on the statement due date. Keep in mind that of that $85,594 a portion (~$33K) is related to what my business owes me (a combination of my direct billable work and the profits of the business).
The Business ($234,962) category decreased from 18% down to 17%. This represents the ownership I have in the private company that I work for. This is an illiquid investment that only gets an update to its value one time per year. I net the company stock asset value of $446,962 against the company stock loan of -$212,000 to arrive at the $234,962. I will be updating the value of this position at the end of the year. I currently have it estimated to be increasing by at least $250,000 (it could be more but I don’t have a good gauge on the value of my options). We will be having a huge influx of liquidity as I get cashed out of my stock in January and my options in February – leading to a $500,000+ liquidity event.
Life Settlements ($95,250) remained flat at 7%. We currently have investments in seven policies at $10,000 each. They are accreting in value by about $1,000 per month. For anyone familiar with options, I liken the fixed return of life settlements to the theta of a short option. In this case, the accreted value is like the theta decay of an option you’ve sold. In more simple terms, with this fixed return you are amortizing (realizing) that value with the passing of time.
The Stocks ($184,153) category increased from 13% to 14% and represents the cumulative value of our brokerage accounts (retirement accounts) that are invested in stocks. However, this is not all of our retirement money, as the majority of our PeerStreet investments are made through a self-directed IRA (worth about $83,000 and counted in the Real Estate category of the pie chart). This will be increasing substantially in January when I pay back the 401K loan, which is currently at $44,346 (down from the original $50,000). I will be getting my yearend bonus payout in January or February for the 2019 calendar year and I have set my 401K contributions to max out as soon as that hits (I’m going to do the same for my HSA). As I prepare for my departure from W-2 employment I have liquidated my stock positions (as of 11/14) and the account is sitting all in cash until I roll it over to another brokerage account that I have early next year.
Total Capital Deployed in 2019:
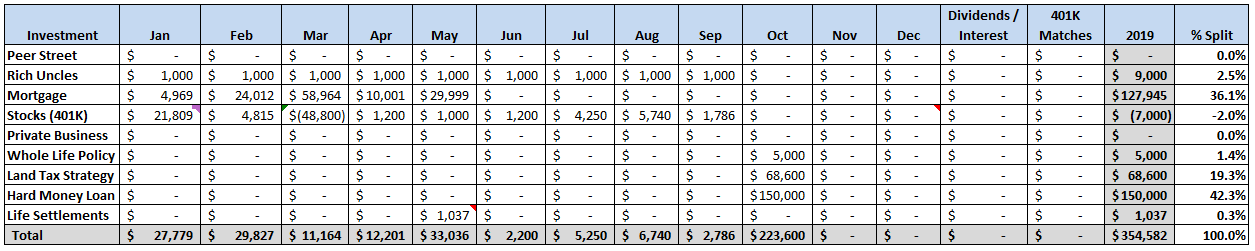
To date for 2019, we have officially deployed almost double the expected $182,000 that I had originally planned to deploy this year. There were no new contributions to Rich Uncles as they have temporarily put a hold on new investments while they work through an acquisition. And since our 401k’s were officially maxed out in September, there will be no new investments there either. I’ll add in all the 401K matches and the reinvested dividends/interest at the end of the year (oh, and the payments to the 401K loan that I took in March), which should put us close to $400,000 in deployed capital for the year.
Gross Income
Income for the month of November was $97,712 vs. $116,170 in October. On a cumulative basis, we have earned $658,020 through November of 2019.
Last month I shared the following:
Although I’m currently projecting $666,992 in total income for 2019, there is a high possibility to achieve something north of $700,000. I now officially feel like a bonafide sandbagger. Since there are no guarantees, I like to under-promise and over-deliver – psychologically it is very rewarding.
And here I am a month later now forecasting our income to finish the year at $747,424 (and that number has some more potential upside still because Mrs. GYFG’s December could be her biggest income month on record).
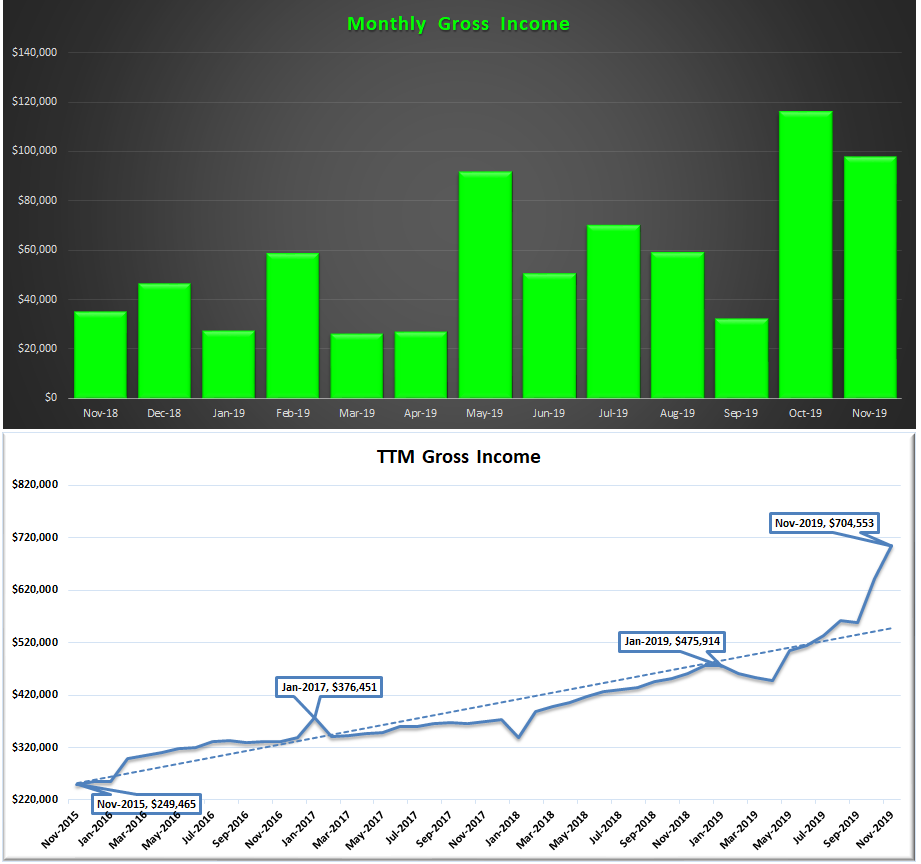
In the second chart above, I also track our income on a trailing twelve months. We recorded a new all-time record in TTM income at $704,553 (up from the TTM of $642,237 last month).
Savings Rate
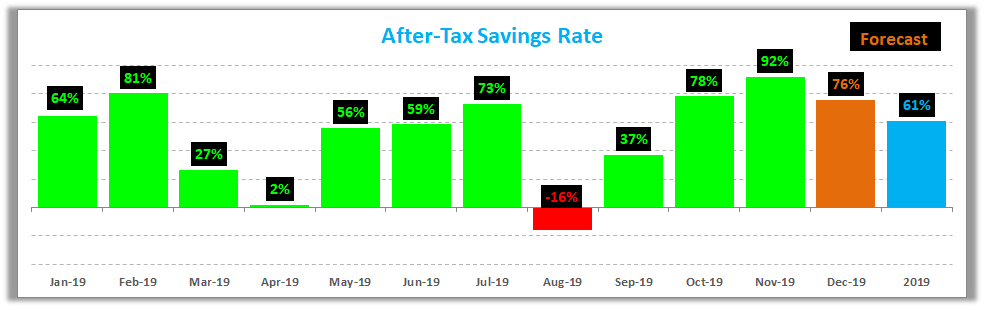
Below is how we actually did towards our goal of saving 50% of our after-tax income. In the chart below, the green bars represent our actual savings rate for the month, the orange bars are what we anticipate based on our 2019 budget, and the blue bar is the projected savings rate for all of 2019.
Our savings rate jumped to 92% in November. I believe I have satisfied my tax obligation for the year with what I’ve paid to date and the large tax deduction ($343,000) that I got by donating some land (the land conversation strategy I touched on last month). The large savings rate this month (a record) was driven by two items in particular:
(1) Our spending was very low at roughly $5,000 for the month vs. the average of around $13,000/month that it has been trending at most of the year (if you include the backyard renovations the average jumps up to roughly $16,000/month). Our spending is much higher this year than in years past but we knowingly and willingly paid for convenience this year as we acclimated to life with a baby and a new business. We do anticipate our spending to decrease down to around $10,000 to $12,000 per month in 2020 for reasons I will write about in a future post.
(2) The other major item is that the income I have received from the business is pre-tax. But like I mentioned above, I believe I’ve satisfied the majority of my tax obligation for the year, at least based on the work I’ve done with my CPA (I could still owe $5,000 to $10,000 when I file but that is normal from year to year).
Do you want to calculate your own savings rate? I’ve made it super easy for you with the savings rate calculator included in the free GYFG FI Toolkit that you can download instantly by clicking the link below. Here’s a peek. Did I mention it’s free? You have nothing to lose and everything to gain, Freedom Fighter! Remember, what gets measured gets managed.


Speaking of savings rate, go check out my post where I mathematically prove the importance of your savings rate as a higher priority in achieving financial independence than your compound return. If you’re trying to build wealth quickly, then you have to read this post.
Closing Thoughts
I will continue to move at a slower pace through December as I rest up to hit the ground running come January. I got to work on my 2020 goals over the Thanksgiving holiday weekend and I will be sharing those in the near future. We did decide to pass on the Arrowhead house we were looking to buy even after the price dropped from $500,000 to $390,000. The home inspection report showed too much structural damage and is we are prepared to take on such a project at this time (we were hoping for something that was mostly cosmetic). We will keep our eye out for other opportunities.
I hope you all enjoyed the Thanksgiving break and I wish you all well during the remainder of the year and holiday season.
– Gen Y Finance Guy
p.s. Personal Capital now offers a 1.55% high yield savings account that is FDIC insured.
11 Responses
Dom, is there a reason you are shifting from PeerStreet to Rich Uncles? Lately I’m skipping any RE hard money investments If interest rates are lower than 11%
Hey FFC,
There are three reasons I’m shifting money from PeerStreet to Rich Uncles:
(1) I actually have two accounts with PeerStreet, one is in a self-directed IRA, and the other is in a after-tax account. So, I am withdrawing the funds from the after-tax account as they are paid back. At my income level the tax efficiency is poor in the after-tax account and I would prefer to do everything through my self-directed IRA that has much more tax efficient. I also don’t need to have two accounts to manage.
(2) I have an arbitrary goal of getting the Rich Uncles account to six-figures.
(3) I also participate in other after-tax hard-money lending outside of any online platform (my own network). I currently have a $150,000 loan extended at 10%.
My criteria or hurdle for making a hard money loan is an LTV of 65% or less and an interest rate of 8% or higher.
Dom
Spectacular work Dom! I also think it’s great that you are taking time for you and your team to recharge and spend time with family over the holidays!
Thanks, RocDoc!
Tell us more details on the conservation easement…. how is it valued, how do you “acquire” the land, what % return on assessment value did you achieve? Thanks and awesome work
Hi JD,
This is on my list of future posts to write.
On this particular deal the appraised value of the conservation easement based on the lands “highest and best use” is worth ~$35M and it was purchased for $6M. This means the multiplier is 5X. So, my fractional ownership of $68,600 that I’m personally donating is worth a $343,000 tax deduction.
The tax deduction for this kind of deal can’t exceed 50% of your AGI. Anything over 50% can rollover for future tax years and I believe the IRS gives you up to 15 years to use it all up.
Dom
Dom – nicely done! It’s great to see your net worth and income charts moving to the right and up. Pretty soon, your net worth and income lines will start running and jumping up like crazy just like your little man.
Thanks, Rich!
I still have a long way to before I reach an eight figure net worth like you (that’s when I’ll be jumping up and down).
Dom
That’s a solid income for this month. Congrats and keep it rollin’!
It’s always inspiring seeing what other bloggers are making 🙂